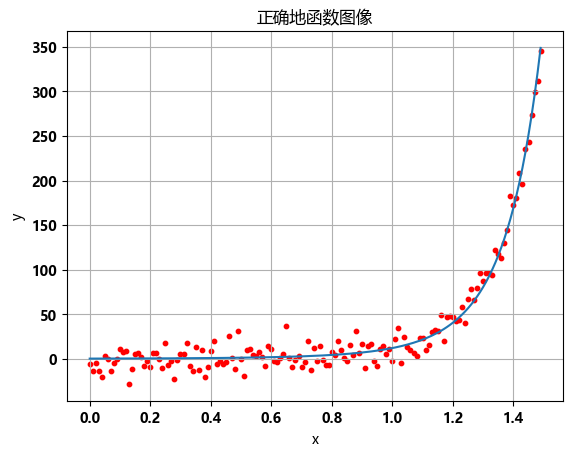
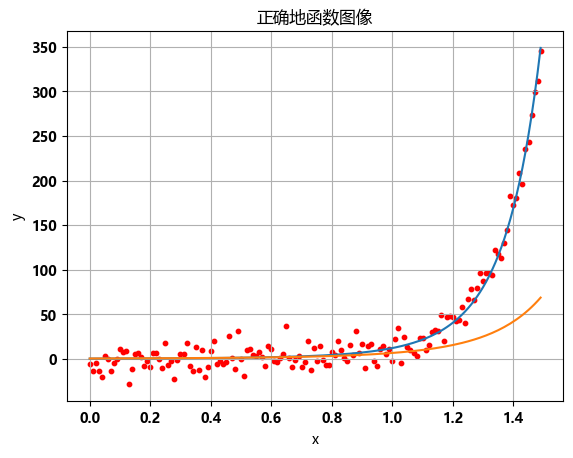
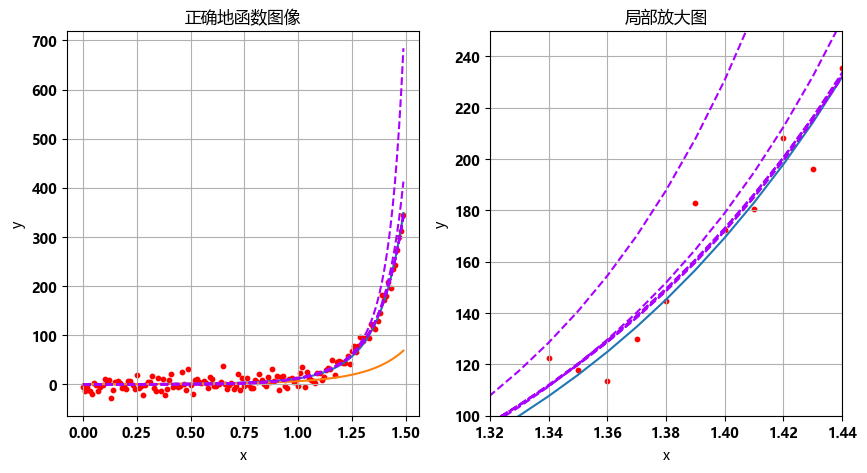
本文使用高斯牛顿法实现曲线拟合
目的
一方面出于学习的目的完成这个小项目,另一方面出于为其他的同学提供一个相关的代码学习资料
拟合方程
数据产生(随机数产生,误差服从高斯分布)
误差定义
求偏导(最关键)
# 产生固定间隔的数组
import numpy as np

start = 0   # 起始值
stop = 1.5   # 结束值(不包含在数组中)
step = 0.01    # 间隔

arr = np.arange(start, stop, step)
# print(arr)


mean = 0    # 均值
std = 10    # 标准差
size = int((stop-start)/step)  # 数组大小

noise = np.random.normal(mean, std, size)
# print(noise)


# 生成观测数据x,y

# 定义函数参数
a = 0.5
b = 1
c = 2.0
d = -1
x=arr
obs_y=np.exp(a*x**3 + b*x**2 + c*x + d)+noise
import matplotlib.pyplot as plt
import matplotlib
matplotlib.rc("font",family='MicroSoft YaHei',weight="bold")
# 绘制图像
# 定义函数
def f(x,A):
return np.exp(A[0]*x**3 + A[1]*x**2 + A[2]*x + A[3])
# 计算对应的 y 值
y = f(x,[a,b,c,d])
plt.plot(x, y)
plt.scatter(x, obs_y, color='red', s=10,label='Scatter Points')
plt.xlabel('x')
plt.ylabel('y')
plt.title('正确地函数图像')
plt.grid(True)
plt.show() 
高斯牛顿迭代进行曲线拟合(我理解为间接平差升级版)
直接求得解析解
# 定义a,b,c,d的初始值(随便定)
a0=0.3
b0=0.7
c0=1.6
d0=-0.7

# 定义函数,A为参数数组
def f0(x,A):
    return np.exp(A[0]*x**3 + A[1]*x**2 + A[2]*x + A[3])

# 计算对应的 y 值
y0 = f0(x,[a0,b0,c0,d0])

plt.plot(x, y)
plt.plot(x, y0)
plt.scatter(x, obs_y, color='red', s=10,label='Scatter Points')
plt.xlabel('x')
plt.ylabel('y')
plt.title('正确地函数图像')
plt.grid(True)
plt.show() 
# 进行间接平差求解
# 构建B矩阵
a0_temp=a0
b0_temp=b0
c0_temp=c0
d0_temp=d0

approx=np.array([a0_temp,b0_temp,c0_temp,d0_temp])

# 迭代次数
n=10
dieDaiResult = np.zeros((n, 4))
# 用一个

for j in range(n):
        B=np.zeros((size,4))
        L=np.zeros((size,1))
        for i in range(size):
            B[i,0]=-x[i]**3*f0(x[i],approx)
            B[i,1]=-x[i]**2*f0(x[i],approx)
            B[i,2]=-x[i]*f0(x[i],approx)
            B[i,3]=-f0(x[i],approx)
            L[i,0]=f0(x[i],approx)-obs_y[i]

        arr_B=np.array(B)
        arr_L=np.array(L)
        tem1=np.linalg.inv(np.dot(np.transpose(arr_B),arr_B))
        tem2=np.dot(np.transpose(arr_B),arr_L)

        delta_x=np.dot(tem1,tem2)
        # 这里进行下一次迭代
        approx=approx+delta_x.flatten()
        # list_approx=approx.
        dieDaiResult[j,:]=approx

fig = plt.figure(figsize=(10, 5))
plt.subplot(1, 2, 1)
# 标准曲线
plt.plot(x, y)
# 初始曲线
plt.plot(x, y0)
# 迭代曲线
for i in range(n-8,n):
      xishu=dieDaiResult[i]
      print(xishu)
      tem_y=f0(x,xishu)
      plt.plot(x, tem_y,color='#aa00ff',linestyle='--')
# plt.plot(x, y1,color='#aa00ff')
plt.scatter(x, obs_y, color='red', s=10,label='Scatter Points')
# plt.plot(x, y1)
plt.xlabel('x')
plt.ylabel('y')
plt.title('正确地函数图像')
plt.grid(True)

# 创建第二个子图
plt.subplot(1, 2, 2)
# 标准曲线
plt.plot(x, y)
# 初始曲线
plt.plot(x, y0)
# 迭代曲线
for i in range(n-8,n):
      xishu=dieDaiResult[i]
      print(xishu)
      tem_y=f0(x,xishu)
      plt.plot(x, tem_y,color='#aa00ff',linestyle='--')
# plt.plot(x, y1,color='#aa00ff')
plt.scatter(x, obs_y, color='red', s=10,label='Scatter Points')
# plt.plot(x, y1)
plt.xlabel('x')
plt.ylabel('y')
plt.title('局部放大图')

# 设置局部放大范围
plt.xlim(1.32, 1.44)  # 设置 x 轴范围
plt.ylim(100, 250)   # 设置 y 轴范围
plt.grid(True)
plt.show()
[ 15.18948191 -48.88914189 58.18225421 -21.87081973]
[ 11.06123187 -37.62392869 48.70588659 -19.61002625]
[ 2.98965953 -9.4558721 16.33702568 -7.39086396]
[-0.25717518 2.86430852 0.85419677 -0.95130386]
[ 2.28260343 -6.65929933 12.58667395 -5.68529249]
[-0.53772553 3.94032672 -0.50831067 -0.38253999]
[ 2.22309202 -6.36924235 12.12862682 -5.44958593]
[-0.55472966 4.00668407 -0.59381963 -0.34621364]


